2015 Wirral Metropolitan Borough Council election
2015 Wirral Metropolitan Borough Council election
(Redirected from Wirral Metropolitan Borough Council election, 2015)
Jump to navigation
Jump to search
| |||||||||||||||||||||||||||||||||||||||||||||||||||||||||||||||||||||||||||||||||||
22 of 66 seats (One Third) to Wirral Metropolitan Borough Council 34 seats needed for a majority | |||||||||||||||||||||||||||||||||||||||||||||||||||||||||||||||||||||||||||||||||||
|---|---|---|---|---|---|---|---|---|---|---|---|---|---|---|---|---|---|---|---|---|---|---|---|---|---|---|---|---|---|---|---|---|---|---|---|---|---|---|---|---|---|---|---|---|---|---|---|---|---|---|---|---|---|---|---|---|---|---|---|---|---|---|---|---|---|---|---|---|---|---|---|---|---|---|---|---|---|---|---|---|---|---|---|
| Turnout | 69.1% ( | ||||||||||||||||||||||||||||||||||||||||||||||||||||||||||||||||||||||||||||||||||
| |||||||||||||||||||||||||||||||||||||||||||||||||||||||||||||||||||||||||||||||||||
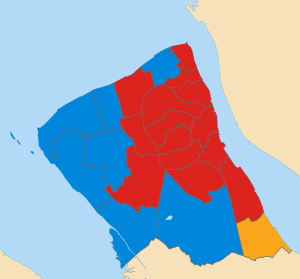 Map of results of 2015 election | |||||||||||||||||||||||||||||||||||||||||||||||||||||||||||||||||||||||||||||||||||
| |||||||||||||||||||||||||||||||||||||||||||||||||||||||||||||||||||||||||||||||||||


The 2015 Wirral Metropolitan Borough Council election took place on 7 May 2015 to elect members of Wirral Metropolitan Borough Council in England.[1] This election was held on the same day as other local elections.
After the election, the composition of the council was:
| Party | Seats | ± | |
|---|---|---|---|
| Labour | 39 | ||
| Conservative | 21 | ||
| Liberal Democrat | 5 | ||
| Green | 1 | ||
[1]
Contents
1 Election results
1.1 Overall election result
1.2 Changes in council composition
2 Ward results
2.1 Bebington
2.2 Bidston and St James
2.3 Birkenhead and Tranmere
2.4 Bromborough
2.5 Clatterbridge
2.6 Claughton
2.7 Eastham
2.8 Greasby, Frankby and Irby
2.9 Heswall
2.10 Hoylake and Meols
2.11 Leasowe and Moreton East
2.12 Liscard
2.13 Moreton West and Saughall Massie
2.14 New Brighton
2.15 Oxton
2.16 Pensby and Thingwall
2.17 Prenton
2.18 Rock Ferry
2.19 Seacombe
2.20 Upton
2.21 Wallasey
2.22 West Kirby and Thurstaston
3 Changes between 2015 and 2016
4 Notes
5 References
Election results[edit]
Overall election result[edit]
Overall result compared with 2014.
| Wirral Metropolitan Borough Council election result, 2015 | |||||||||||||||
|---|---|---|---|---|---|---|---|---|---|---|---|---|---|---|---|
| Party | Candidates | Votes | |||||||||||||
| Stood | Elected | Gained | Unseated | Net | % of total | % | № | Net % | |||||||
| | Labour | 22 | 14 | 1 | 0 | 63.6 | 47.9 | 79,409 | |||||||
| | Conservative | 21 | 7 | 0 | 0 | 31.8 | 28.1 | 46,611 | |||||||
| | UKIP | 20 | 0 | 0 | 0 | 0.0 | 9.0 | 14,919 | |||||||
| | Liberal Democrat | 18 | 1 | 0 | 1 | 4.5 | 8.2 | 13,572 | |||||||
| | Green | 22 | 0 | 0 | 0 | 0.0 | 6.3 | 10,446 | |||||||
| | TUSC | 6 | 0 | 0 | 0 | 0.0 | 0.4 | 632 | |||||||
| | Independent | 3 | 0 | 0 | 0 | 0.0 | 0.1 | 195 | |||||||
[1][2]
Changes in council composition[edit]
Prior to the election the composition of the council was:
38 | 21 | 6 | 1 |
Lab | Con | LD | G |
After the election the composition of the council was:
39 | 21 | 5 | 1 |
Lab | Con | LD | G |

Wirral Metropolitan Borough Council composition after the 2015 election
Ward results[edit]
Bebington[edit]
| Party | Candidate | Votes | % | ± | |
|---|---|---|---|---|---|
Labour | Jerry Williams | 5,107 | 57.7 | ||
Conservative | Des Drury | 2,106 | 23.8 | ||
UKIP | Jim Bradshaw | 931 | 10.5 | ||
Green | Anthony Smith | 452 | 5.1 | ||
Liberal Democrat | Brian Gill | 261 | 2.9 | ||
| Majority | 3,001 | 33.9 | |||
Registered electors | 12,107 | ||||
Turnout | 73.7 | ||||
Labour hold | Swing | ||||
[3][4]
Bidston and St James[edit]
| Party | Candidate | Votes | % | ± | |
|---|---|---|---|---|---|
Labour | Brian Kenny | 4,255 | 76.9 | ||
Conservative | Geoffrey Dormand | 590 | 10.7 | ||
Green | Karl Cumings | 316 | 5.7 | ||
TUSC | Ben Halligan | 199 | 3.6 | ||
Liberal Democrat | Roy Wood | 175 | 3.2 | ||
| Majority | 3,665 | 66.2 | |||
Registered electors | 10,049 | ||||
Turnout | 56.0 | ||||
Labour hold | Swing | ||||
[5][6]
Birkenhead and Tranmere[edit]
| Party | Candidate | Votes | % | ± | |
|---|---|---|---|---|---|
Labour | Phillip Davies | 3,130 | 56.0 | ||
Green | Jayne Clough | 1,763 | 31.6 | ||
UKIP | Laurence Sharpe-Stevens | 447 | 8.0 | ||
Conservative | June Cowin | 183 | 3.3 | ||
Liberal Democrat | Mary Price | 61 | 1.1 | New | |
| Majority | 1,367 | 24.5 | N/A | ||
Registered electors | 9,854 | ||||
Turnout | 56.9 | ||||
Labour hold | Swing | ||||
[7][8]
Bromborough[edit]
| Party | Candidate | Votes | % | ± | |
|---|---|---|---|---|---|
Labour | Joe Walsh | 4,478 | 59.3 | ||
Conservative | Mike Collins | 1,396 | 18.5 | ||
UKIP | Sue Colquhoun | 865 | 11.5 | ||
Liberal Democrat | Penelope Golby | 367 | 4.9 | ||
Green | Percy Hogg | 330 | 4.4 | ||
TUSC | Mark Halligan | 118 | 1.6 | New | |
| Majority | 3,082 | 40.8 | |||
Registered electors | 11,464 | ||||
Turnout | 66.3 | ||||
Labour hold | Swing | ||||
[9][10]
Clatterbridge[edit]
| Party | Candidate | Votes | % | ± | |
|---|---|---|---|---|---|
Conservative | Adam Sykes | 3,656 | 41.3 | ||
Labour | Jenny Holliday | 3,371 | 38.1 | ||
UKIP | Roger Jones | 864 | 9.8 | ||
Liberal Democrat | Jan Cambridge | 644 | 7.3 | ||
Green | Vinny Spencer | 323 | 3.6 | ||
| Majority | 285 | 3.2 | |||
Registered electors | 11,689 | ||||
Turnout | 76.2 | ||||
Conservative hold | Swing | ||||
[11][12]
Claughton[edit]
| Party | Candidate | Votes | % | ± | |
|---|---|---|---|---|---|
Labour | Stephen Foulkes | 4,101 | 56.8 | ||
Conservative | Barbara Sinclair | 1,309 | 18.1 | ||
UKIP | Philip Griffiths | 810 | 11.2 | ||
Liberal Democrat | Christopher Teggin | 512 | 7.1 | ||
Green | Tom Cubbin | 488 | 6.8 | ||
| Majority | 2,792 | 38.7 | |||
Registered electors | 11,266 | ||||
Turnout | 64.5 | ||||
Labour hold | Swing | ||||
[13][14]
Eastham[edit]
| Party | Candidate | Votes | % | ± | |
|---|---|---|---|---|---|
Liberal Democrat | Dave Mitchell | 3,589 | 45.1 | ||
Labour | Helen Robinson | 2,772 | 34.8 | ||
Conservative | Keith Jack | 1,314 | 16.5 | ||
Green | Paul Cartlidge | 291 | 3.7 | ||
| Majority | 817 | 10.3 | |||
Registered electors | 11,089 | ||||
Turnout | 72.5 | ||||
Liberal Democrat hold | Swing | ||||
[15][16]
Greasby, Frankby and Irby[edit]
| Party | Candidate | Votes | % | ± | |
|---|---|---|---|---|---|
Conservative | David Burgess-Joyce | 3,655 | 40.4 | ||
Labour | Julie McManus | 2,980 | 33.0 | ||
Liberal Democrat | Peter Reisdorf | 1,330 | 14.7 | ||
UKIP | Laurence Jones | 723 | 8.0 | ||
Green | Catherine Page | 352 | 3.9 | ||
| Majority | 675 | 7.4 | |||
Registered electors | 11,583 | ||||
Turnout | 78.4 | ||||
Conservative hold | Swing | ||||
[17][18][19][20]
Heswall[edit]
| Party | Candidate | Votes | % | ± | |
|---|---|---|---|---|---|
Conservative | Andrew Hodson | 5,035 | 59.5 | ||
Labour | Mike Holliday | 1,718 | 20.3 | ||
UKIP | David Scott | 715 | 8.4 | ||
Liberal Democrat | David Tyrrell | 535 | 6.3 | ||
Green | Barbara Burton | 464 | 5.4 | ||
| Majority | 3,317 | 39.2 | |||
Registered electors | 10,874 | ||||
Turnout | 78.5 | ||||
Conservative hold | Swing | ||||
[21][22]
Hoylake and Meols[edit]
| Party | Candidate | Votes | % | ± | |
|---|---|---|---|---|---|
Conservative | Gerry Ellis | 4,125 | 50.8 | ||
Labour | Bill McGenity | 2,367 | 29.1 | ||
Green | Yvonne McGinley | 758 | 9.3 | ||
UKIP | George Robinson | 497 | 6.1 | ||
Liberal Democrat | Michael Redfern | 374 | 4.6 | ||
| Majority | 1,758 | 21.7 | |||
Registered electors | 10,610 | ||||
Turnout | 77.0 | ||||
Conservative hold | Swing | ||||
[23][24]
Leasowe and Moreton East[edit]
| Party | Candidate | Votes | % | ± | |
|---|---|---|---|---|---|
Labour | Ron Abbey | 4,297 | 60.8 | ||
Conservative | Denis Knowles | 1,744 | 24.7 | ||
UKIP | Jan Davison | 734 | 10.4 | ||
Green | Craig Reynolds | 291 | 4.1 | ||
| Majority | 2,553 | 36.1 | |||
Registered electors | 10,764 | ||||
Turnout | 65.9 | ||||
Labour hold | Swing | ||||
[25][26][27]
Liscard[edit]
| Party | Candidate | Votes | % | ± | |
|---|---|---|---|---|---|
Labour | Bernie Mooney | 4,397 | 62.9 | ||
UKIP | Lynda Williams | 1,352 | 19.4 | ||
Liberal Democrat | Daniel Clein | 578 | 8.3 | ||
Green | Lindsey Stowell-Smith | 542 | 7.8 | ||
TUSC | Adam Khan | 118 | 1.7 | New | |
| Majority | 3,045 | 43.5 | |||
Registered electors | 11,091 | ||||
Turnout | 64.5 | ||||
Labour hold | Swing | ||||
[28][29]
Moreton West and Saughall Massie[edit]
| Party | Candidate | Votes | % | ± | |
|---|---|---|---|---|---|
Conservative | Steve Williams | 3,324 | 44.3 | ||
Labour | Karl Greaney | 3,191 | 42.5 | ||
UKIP | Susan Whitham | 716 | 9.5 | ||
Green | Perle Sheldricks | 272 | 3.6 | ||
| Majority | 133 | 1.8 | |||
Registered electors | 10,860 | ||||
Turnout | 69.3 | ||||
Conservative hold | Swing | ||||
[30][31]
New Brighton[edit]
| Party | Candidate | Votes | % | ± | |
|---|---|---|---|---|---|
Labour | Patrick Hackett | 3,822 | 52.5 | ||
Conservative | Tony Pritchard | 2,223 | 30.6 | ||
Green | Gillian Homeri | 634 | 8.7 | ||
UKIP | Tim Power | 595 | 8.2 | ||
| Majority | 1,599 | 21.9 | |||
Registered electors | 11,003 | ||||
Turnout | 66.4 | ||||
Labour hold | Swing | ||||
[32][33][34]
Oxton[edit]
| Party | Candidate | Votes | % | ± | |
|---|---|---|---|---|---|
Labour | Paul Doughty [n 1] | 3,085 | 39.7 | ||
Liberal Democrat | Stuart Kelly | 2,788 | 35.9 | ||
Conservative | Hilary Jones | 854 | 11.0 | ||
UKIP | David Martin | 615 | 7.9 | ||
Green | Liz Heydon | 424 | 5.5 | ||
| Majority | 297 | 3.8 | N/A | ||
Registered electors | 11,236 | ||||
Turnout | 69.4 | ||||
Labour gain from Liberal Democrat | Swing | ||||
[35][36][37]
Pensby and Thingwall[edit]
| Party | Candidate | Votes | % | ± | |
|---|---|---|---|---|---|
Labour | Phillip Brightmore | 3,085 | 39.1 | ||
Conservative | Ian MacKenzie | 2,918 | 36.9 | ||
UKIP | Hilary Jones | 796 | 10.1 | ||
Liberal Democrat | Damien Cummins | 602 | 7.6 | ||
Green | Allen Burton | 378 | 4.8 | ||
Independent | Maureen Wilkinson | 69 | 0.9 | New | |
TUSC | Phil Simpson | 50 | 0.6 | New | |
| Majority | 167 | 2.2 | |||
Registered electors | 10,589 | ||||
Turnout | 75.2 | ||||
Labour hold | Swing | ||||
[38][39]
Prenton[edit]
| Party | Candidate | Votes | % | ± | |
|---|---|---|---|---|---|
Labour | Angela Davies | 4,362 | 59.3 | ||
Conservative | Robert Hughes | 1,307 | 17.8 | ||
UKIP | James Shorthall | 864 | 11.7 | ||
Liberal Democrat | Allan Brame | 481 | 6.5 | ||
Green | Moira Gommon | 342 | 4.6 | ||
| Majority | 3,055 | 41.5 | |||
Registered electors | 10,790 | ||||
Turnout | 68.4 | ||||
Labour hold | Swing | ||||
[40][41][42]
Rock Ferry[edit]
| Party | Candidate | Votes | % | ± | |
|---|---|---|---|---|---|
Labour | Chris Meaden | 3,767 | 66.7 | ||
UKIP | Terry Hansen | 617 | 10.9 | ||
Conservative | Cy Ferguson | 552 | 9.8 | ||
Green | Paul Harris | 430 | 7.6 | ||
Liberal Democrat | Brian Hall | 148 | 2.6 | ||
TUSC | Morag Reid | 72 | 1.3 | ||
Independent | Jim Pritchard | 62 | 1.1 | ||
| Majority | 3,150 | 55.8 | |||
Registered electors | 9,727 | ||||
Turnout | 58.3 | ||||
Labour hold | Swing | ||||
[43][44]
Seacombe[edit]
| Party | Candidate | Votes | % | ± | |
|---|---|---|---|---|---|
Labour | Chris Jones | 4,157 | 71.1 | ||
UKIP | Christopher Wellstead | 726 | 12.4 | ||
Conservative | Christine Jones | 581 | 9.9 | ||
Green | Lily Clough | 244 | 4.2 | ||
TUSC | Gregory North | 75 | 1.3 | New | |
Independent | Karl Mercer | 64 | 1.1 | ||
| Majority | 3,431 | 58.7 | |||
Registered electors | 10,309 | ||||
Turnout | 57.1 | ||||
Labour hold | Swing | ||||
[45][46]
Upton[edit]
| Party | Candidate | Votes | % | ± | |
|---|---|---|---|---|---|
Labour | Tony Smith | 5,347 | 62.4 | ||
Conservative | Geoffrey Gubb | 1,807 | 21.1 | ||
UKIP | Geoffrey Caton | 853 | 9.9 | ||
Green | Marian Hussenbux | 306 | 3.6 | ||
Liberal Democrat | Alan Davies | 262 | 3.1 | ||
| Majority | 3,540 | 41.3 | |||
Registered electors | 12,394 | ||||
Turnout | 69.6 | ||||
Labour hold | Swing | ||||
[47][48]
Wallasey[edit]
| Party | Candidate | Votes | % | ± | |
|---|---|---|---|---|---|
Conservative | Paul Hayes | 3,831 | 44.8 | ||
Labour | Giuseppe Roberto | 3,309 | 38.7 | ||
UKIP | Brian Farrell | 647 | 7.6 | ||
Green | Cynthia Stonall | 464 | 5.4 | ||
Liberal Democrat | John Codling | 302 | 3.5 | ||
| Majority | 522 | 6.1 | |||
Registered electors | 11,871 | ||||
Turnout | 72.5 | ||||
Conservative hold | Swing | ||||
[49][50]
West Kirby and Thurstaston[edit]
| Party | Candidate | Votes | % | ± | |
|---|---|---|---|---|---|
Conservative | David Elderton | 4,099 | 50.6 | ||
Labour | Thomas Usher | 2,311 | 28.5 | ||
Green | Trevor Desrosiers | 582 | 7.2 | ||
Liberal Democrat | John Cresswell | 563 | 6.9 | ||
UKIP | Dave Evennett | 552 | 6.8 | ||
| Majority | 1,788 | 22.1 | |||
Registered electors | 10,380 | ||||
Turnout | 78.7 | ||||
Conservative hold | Swing | ||||
[51][52][53]
Changes between 2015 and 2016[edit]
| Date | Ward | Name | Previous affiliation | New affiliation | Circumstance | ||
|---|---|---|---|---|---|---|---|
| ? | Bromborough | Steve Niblock | Labour | Independent | Deselected.[54] | ||
Notes[edit]
^ Incumbent councillor for Prenton ward.
• italics denote the sitting councillor • bold denotes the winning candidate
References[edit]
^ abc "Election Result for 7 May 2015 Summary". Wirral Metropolitan Borough Council..mw-parser-output cite.citationfont-style:inherit.mw-parser-output .citation qquotes:"""""""'""'".mw-parser-output .citation .cs1-lock-free abackground:url("//upload.wikimedia.org/wikipedia/commons/thumb/6/65/Lock-green.svg/9px-Lock-green.svg.png")no-repeat;background-position:right .1em center.mw-parser-output .citation .cs1-lock-limited a,.mw-parser-output .citation .cs1-lock-registration abackground:url("//upload.wikimedia.org/wikipedia/commons/thumb/d/d6/Lock-gray-alt-2.svg/9px-Lock-gray-alt-2.svg.png")no-repeat;background-position:right .1em center.mw-parser-output .citation .cs1-lock-subscription abackground:url("//upload.wikimedia.org/wikipedia/commons/thumb/a/aa/Lock-red-alt-2.svg/9px-Lock-red-alt-2.svg.png")no-repeat;background-position:right .1em center.mw-parser-output .cs1-subscription,.mw-parser-output .cs1-registrationcolor:#555.mw-parser-output .cs1-subscription span,.mw-parser-output .cs1-registration spanborder-bottom:1px dotted;cursor:help.mw-parser-output .cs1-ws-icon abackground:url("//upload.wikimedia.org/wikipedia/commons/thumb/4/4c/Wikisource-logo.svg/12px-Wikisource-logo.svg.png")no-repeat;background-position:right .1em center.mw-parser-output code.cs1-codecolor:inherit;background:inherit;border:inherit;padding:inherit.mw-parser-output .cs1-hidden-errordisplay:none;font-size:100%.mw-parser-output .cs1-visible-errorfont-size:100%.mw-parser-output .cs1-maintdisplay:none;color:#33aa33;margin-left:0.3em.mw-parser-output .cs1-subscription,.mw-parser-output .cs1-registration,.mw-parser-output .cs1-formatfont-size:95%.mw-parser-output .cs1-kern-left,.mw-parser-output .cs1-kern-wl-leftpadding-left:0.2em.mw-parser-output .cs1-kern-right,.mw-parser-output .cs1-kern-wl-rightpadding-right:0.2em
^ "Local Election Results 2015 Wirral". Local Elections Archive Project.
^ "Election Result for Bebington ward on 7 May 2015". Wirral Metropolitan Borough Council.
^ "Councillor Jerry Williams". Wirral Metropolitan Borough Council.
^ "Election Result for Bidston and St James ward on 7 May 2015". Wirral Metropolitan Borough Council.
^ "Councillor Brian Kenny". Wirral Metropolitan Borough Council.
^ "Election Result for Birkenhead and Tranmere ward on 7 May 2015". Wirral Metropolitan Borough Council.
^ "Councillor Phil Davies". Wirral Metropolitan Borough Council.
^ "Election Result for Bromborough ward on 7 May 2015". Wirral Metropolitan Borough Council.
^ "Councillor Joe Walsh". Wirral Metropolitan Borough Council.
^ "Election Result for Clatterbridge ward on 7 May 2015". Wirral Metropolitan Borough Council.
^ "Councillor Adam Sykes". Wirral Metropolitan Borough Council.
^ "Election Result for Claughton ward on 7 May 2015". Wirral Metropolitan Borough Council.
^ "Councillor Steve Foulkes". Wirral Metropolitan Borough Council.
^ "Election Result for Eastham ward on 7 May 2015". Wirral Metropolitan Borough Council.
^ "Councillor Dave Mitchell". Wirral Metropolitan Borough Council.
^ "Election Result for Greasby, Frankby and Irby ward on 7 May 2015". Wirral Metropolitan Borough Council.
^ "Councillor David Burgess-Joyce". Wirral Metropolitan Borough Council.
^ "Councillor Julie McManus". Wirral Metropolitan Borough Council.
^ "Councillor Peter Reisdorf". Wirral Metropolitan Borough Council.
^ "Election Result for Heswall ward on 7 May 2015". Wirral Metropolitan Borough Council.
^ "Councillor Andrew Hodson". Wirral Metropolitan Borough Council.
^ "Election Result for Hoylake and Meols ward on 7 May 2015". Wirral Metropolitan Borough Council.
^ "Councillor Gerry Ellis". Wirral Metropolitan Borough Council.
^ "Election Result for Leasowe and Moreton East ward on 7 May 2015". Wirral Metropolitan Borough Council.
^ "Councillor Ron Abbey". Wirral Metropolitan Borough Council.
^ "Councillor Denis Knowles". Wirral Metropolitan Borough Council.
^ "Election Result for Liscard ward on 7 May 2015". Wirral Metropolitan Borough Council.
^ "Councillor Bernie Mooney". Wirral Metropolitan Borough Council.
^ "Election Result for Moreton West and Saughall Massie ward on 7 May 2015". Wirral Metropolitan Borough Council.
^ "Councillor Steve Williams". Wirral Metropolitan Borough Council.
^ "Election Result for New Brighton ward on 7 May 2015". Wirral Metropolitan Borough Council.
^ "Councillor Pat Hackett". Wirral Metropolitan Borough Council.
^ "Councillor Tony Pritchard". Wirral Metropolitan Borough Council.
^ "Election Result for Oxton ward on 7 May 2015". Wirral Metropolitan Borough Council.
^ "Councillor Paul Doughty". Wirral Metropolitan Borough Council.
^ "Councillor Stuart Kelly". Wirral Metropolitan Borough Council.
^ "Election Result for Pensby and Thingwall ward on 7 May 2015". Wirral Metropolitan Borough Council.
^ "Councillor Phillip Brightmore". Wirral Metropolitan Borough Council.
^ "Election Result for Prenton ward on 7 May 2015". Wirral Metropolitan Borough Council.
^ "Councillor Angela Davies". Wirral Metropolitan Borough Council.
^ "Councillor Allan Brame". Wirral Metropolitan Borough Council.
^ "Election Result for Rock Ferry ward on 7 May 2015". Wirral Metropolitan Borough Council.
^ "Councillor Chris Meaden". Wirral Metropolitan Borough Council.
^ "Election Result for Seacombe ward on 7 May 2015". Wirral Metropolitan Borough Council.
^ "Councillor Chris Jones". Wirral Metropolitan Borough Council.
^ "Election Result for Upton ward on 7 May 2015". Wirral Metropolitan Borough Council.
^ "Councillor Tony Smith". Wirral Metropolitan Borough Council.
^ "Election Result for Wallasey ward on 7 May 2015". Wirral Metropolitan Borough Council.
^ "Councillor Paul Hayes". Wirral Metropolitan Borough Council.
^ "Election Result for West Kirby and Thurstaston ward on 7 May 2015". Wirral Metropolitan Borough Council.
^ "Councillor David M Elderton". Wirral Metropolitan Borough Council.
^ "Councillor Thomas Usher". Wirral Metropolitan Borough Council.
^ "Battle lines drawn for Wirral's council elections on May 5". Wirral Globe. 9 April 2016. Retrieved 31 December 2018.
(2014 ←) | |
|---|---|
| Metropolitan boroughs |
|
Unitary authorities (England) |
|
District councils (England) |
|
| Mayoral elections |
|
| |
| Knowsley Metropolitan Borough Council |
|
|---|---|
| Liverpool City Council |
|
| Mayor of Liverpool |
|
| Sefton Metropolitan Borough Council |
|
| St Helens Metropolitan Borough Council |
|
| Wirral Metropolitan Borough Council |
|
| Liverpool School Board |
|
| Merseyside County Council |
|
| Liverpool City Region Mayor |
|
| |
Categories:
- 2015 English local elections
- May 2015 events in the United Kingdom
- Council elections in Wirral
- 21st century in Merseyside
(window.RLQ=window.RLQ||).push(function()mw.config.set("wgPageParseReport":"limitreport":"cputime":"1.360","walltime":"1.597","ppvisitednodes":"value":14720,"limit":1000000,"ppgeneratednodes":"value":0,"limit":1500000,"postexpandincludesize":"value":383238,"limit":2097152,"templateargumentsize":"value":47581,"limit":2097152,"expansiondepth":"value":18,"limit":40,"expensivefunctioncount":"value":12,"limit":500,"unstrip-depth":"value":1,"limit":20,"unstrip-size":"value":150721,"limit":5000000,"entityaccesscount":"value":0,"limit":400,"timingprofile":["100.00% 999.292 1 -total"," 31.76% 317.416 2 Template:Reflist"," 28.99% 289.725 1 Template:Infobox_election"," 26.43% 264.139 53 Template:Cite_web"," 21.36% 213.480 1 Template:Infobox"," 12.82% 128.113 3 Template:Infobox_election/row"," 7.30% 72.929 90 Template:Election_box_candidate_with_party_link"," 4.72% 47.162 7 Template:Election_Summary_Party_with_Candidates"," 4.47% 44.714 1 Template:Main"," 3.99% 39.884 2 Template:Navbox"],"scribunto":"limitreport-timeusage":"value":"0.308","limit":"10.000","limitreport-memusage":"value":5117533,"limit":52428800,"cachereport":"origin":"mw1296","timestamp":"20190317044927","ttl":2592000,"transientcontent":false););"@context":"https://schema.org","@type":"Article","name":"2015 Wirral Metropolitan Borough Council election","url":"https://en.wikipedia.org/wiki/2015_Wirral_Metropolitan_Borough_Council_election","sameAs":"http://www.wikidata.org/entity/Q20128189","mainEntity":"http://www.wikidata.org/entity/Q20128189","author":"@type":"Organization","name":"Contributors to Wikimedia projects","publisher":"@type":"Organization","name":"Wikimedia Foundation, Inc.","logo":"@type":"ImageObject","url":"https://www.wikimedia.org/static/images/wmf-hor-googpub.png","datePublished":"2015-03-26T19:43:18Z","dateModified":"2019-03-03T19:23:24Z","image":"https://upload.wikimedia.org/wikipedia/commons/3/3e/Cllr_Phil_Davies_portrait.jpg"(window.RLQ=window.RLQ||).push(function()mw.config.set("wgBackendResponseTime":195,"wgHostname":"mw1270"););


