2012 Wirral Metropolitan Borough Council election
2012 Wirral Metropolitan Borough Council election
Jump to navigation
Jump to search
| |||||||||||||||||||||||||||||||||||||||||||||||||||||
22 of 66 seats (One Third) to Wirral Metropolitan Borough Council 34 seats needed for a majority | |||||||||||||||||||||||||||||||||||||||||||||||||||||
|---|---|---|---|---|---|---|---|---|---|---|---|---|---|---|---|---|---|---|---|---|---|---|---|---|---|---|---|---|---|---|---|---|---|---|---|---|---|---|---|---|---|---|---|---|---|---|---|---|---|---|---|---|---|
| Turnout | 36.4% ( | ||||||||||||||||||||||||||||||||||||||||||||||||||||
| |||||||||||||||||||||||||||||||||||||||||||||||||||||
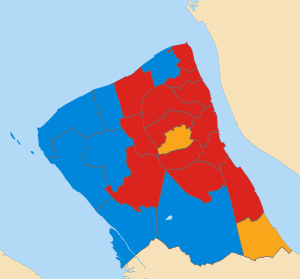 Map of results of 2012 election | |||||||||||||||||||||||||||||||||||||||||||||||||||||
| |||||||||||||||||||||||||||||||||||||||||||||||||||||


The 2012 Wirral Metropolitan Borough Council election took place on 3 May 2012 to elect members of Wirral Metropolitan Borough Council in England.[1] This election was held on the same day as other local elections.
Overall, Labour gained seven seats at the expense of the Conservatives and Liberal Democrats and gained overall control of the council, with a majority of eight.[2]
After the election, the composition of the council was:
| Party | Seats | ± | |
|---|---|---|---|
| Labour | 37 | ||
| Conservative | 22 | ||
| Liberal Democrat | 7 | ||
[1]
Contents
1 Election results
1.1 Overall election result
1.2 Changes in council composition
2 Ward results
2.1 Bebington
2.2 Bidston and St James
2.3 Birkenhead and Tranmere
2.4 Bromborough
2.5 Clatterbridge
2.6 Claughton
2.7 Eastham
2.8 Greasby, Frankby and Irby
2.9 Heswall
2.10 Hoylake and Meols
2.11 Leasowe and Moreton East
2.12 Liscard
2.13 Moreton West and Saughall Massie
2.14 New Brighton
2.15 Oxton
2.16 Pensby and Thingwall
2.17 Prenton
2.18 Rock Ferry
2.19 Seacombe
2.20 Upton
2.21 Wallasey
2.22 West Kirby and Thurstaston
3 Changes between 2012 and 2014
3.1 Leasowe and Moreton East by-election 2013
3.2 Heswall by-election 2013
3.3 Pensby and Thingwall by-election 2013
3.4 Upton by-election 2013
3.5 Other changes
4 Notes
5 References
Election results[edit]
Overall election result[edit]
Overall result compared with 2011.
| Wirral Metropolitan Borough Council election result, 2012 | |||||||||||||||
|---|---|---|---|---|---|---|---|---|---|---|---|---|---|---|---|
| Party | Candidates | Votes | |||||||||||||
| Stood | Elected | Gained | Unseated | Net | % of total | % | № | Net % | |||||||
| | Labour | 22 | 13 | 7 | 0 | 59.1 | 44.6 | 38,455 | |||||||
| | Conservative | 22 | 7 | 0 | 5 | 31.8 | 30.6 | 26,426 | |||||||
| | Liberal Democrat | 16 | 2 | 0 | 2 | 9.1 | 10.9 | 9,375 | |||||||
| | UKIP | 22 | 0 | 0 | 0 | 0.0 | 7.4 | 6,378 | |||||||
| | Green | 22 | 0 | 0 | 0 | 0.0 | 5.9 | 5,064 | |||||||
| | Independent | 3 | 0 | 0 | 1 | 0.0 | 0.4 | 364 | |||||||
| | TUSC | 1 | 0 | 0 | 0 | 0.0 | 0.2 | 130 | N/A | ||||||
| | BNP | 1 | 0 | 0 | 0 | 0.0 | 0.1 | 61 | N/A | ||||||
[1]
Changes in council composition[edit]
Prior to the election the composition of the council was:
30 | 27 | 9 |
Lab | Con | LD |
After the election the composition of the council was:
37 | 21 | 7 |
Lab | Con | LD |
Ward results[edit]
Results compared directly with the last local election in 2011.
Bebington[edit]
| Party | Candidate | Votes | % | ± | |
|---|---|---|---|---|---|
Labour | Christina Muspratt | 2,572 | 53.8 | ||
Conservative | Sheila Clarke | 1,513 | 31.6 | ||
UKIP | Hilary Jones | 386 | 8.1 | ||
Green | Michael Harper | 173 | 3.6 | ||
Liberal Democrat | Peter Faulkner | 40 | 2.9 | New | |
| Majority | 1,059 | 22.2 | |||
Registered electors | 11,886 | ||||
Turnout | 40.4 | ||||
Labour gain from Conservative | Swing | ||||
[3][4][5]
Bidston and St James[edit]
| Party | Candidate | Votes | % | ± | |
|---|---|---|---|---|---|
Labour | Jim Crabtree | 1,992 | 78.2 | ||
Conservative | Peter Dawson | 179 | 7.0 | ||
UKIP | Helen Romnes | 136 | 5.3 | ||
Green | Colin Dignam-Gill | 85 | 3.3 | New | |
Independent | John Brace | 82 | 3.2 | New | |
Liberal Democrat | Peter Faulkner | 73 | 2.9 | ||
| Majority | 1,813 | 71.2 | |||
Registered electors | 9,817 | ||||
Turnout | 26.0 | ||||
Labour hold | Swing | ||||
[6][7]
Birkenhead and Tranmere[edit]
| Party | Candidate | Votes | % | ± | |
|---|---|---|---|---|---|
Labour | Jean Stapleton | 1,474 | 49.7 | ||
Green | Pat Cleary | 1,215 | 41.0 | ||
UKIP | David Martin | 99 | 3.3 | ||
Liberal Democrat | Allan Brame | 61 | 2.1 | ||
BNP | Joe Killen | 61 | 2.1 | New | |
Conservative | June Cowin | 54 | 1.8 | ||
| Majority | 259 | 8.7 | |||
Registered electors | 9,527 | ||||
Turnout | 31.2 | ||||
Labour hold | Swing | ||||
[8][9][10]
Bromborough[edit]
| Party | Candidate | Votes | % | ± | |
|---|---|---|---|---|---|
Labour | Steve Niblock | 2,292 | 64.8 | ||
Conservative | Kathryn Hodson | 466 | 13.2 | ||
UKIP | Timothy Pass | 298 | 8.4 | ||
Liberal Democrat | Penelope Golby | 296 | 8.4 | ||
Green | Percy Hogg | 187 | 5.3 | ||
| Majority | 1,826 | 51.6 | |||
Registered electors | 10,969 | ||||
Turnout | 32.4 | ||||
Labour hold | Swing | ||||
[11][12][13]
Clatterbridge[edit]
| Party | Candidate | Votes | % | ± | |
|---|---|---|---|---|---|
Conservative | Cherry Povall | 2,220 | 47.0 | ||
Labour | Phillip Brightmore | 1,623 | 34.4 | ||
UKIP | Roger Jones | 370 | 7.8 | ||
Liberal Democrat | Simon Thomson | 337 | 7.1 | ||
Green | Jim McGinley | 174 | 3.7 | ||
| Majority | 597 | 12.6 | |||
Registered electors | 11,640 | ||||
Turnout | 40.7 | ||||
Conservative hold | Swing | ||||
[14][15][16]
Claughton[edit]
| Party | Candidate | Votes | % | ± | |
|---|---|---|---|---|---|
Labour | George Davies | 2,367 | 65.6 | ||
Conservative | Barbara Sinclair | 575 | 15.9 | ||
UKIP | Bethan Williams | 304 | 8.4 | ||
Liberal Democrat | Christopher Teggin | 187 | 5.2 | ||
Green | Cathy Page | 177 | 4.9 | ||
| Majority | 1,792 | 49.7 | |||
Registered electors | 11,054 | ||||
Turnout | 32.7 | ||||
Labour hold | Swing | ||||
[17][18]
Eastham[edit]
| Party | Candidate | Votes | % | ± | |
|---|---|---|---|---|---|
Liberal Democrat | Phillip Gilchrist | 2,151 | 50.2 | ||
Labour | Mike Thompson | 1,539 | 36.0 | ||
Conservative | Kevin Sharkey | 315 | 7.4 | ||
UKIP | Laurence Jones | 219 | 5.1 | ||
Green | Jackie Smith | 55 | 1.3 | New | |
| Majority | 612 | 14.3 | |||
Registered electors | 10,964 | ||||
Turnout | 39.2 | ||||
Liberal Democrat hold | Swing | ||||
[19][20]
Greasby, Frankby and Irby[edit]
| Party | Candidate | Votes | % | ± | |
|---|---|---|---|---|---|
Conservative | Tony Cox | 1,820 | 37.3 | ||
Liberal Democrat | Peter Reisdorf | 1,277 | 26.1 | ||
Labour | Lee Rushworth | 1,159 | 23.7 | ||
UKIP | Derek Snowden | 421 | 8.6 | ||
Green | Rachel Markey | 208 | 4.3 | ||
| Majority | 543 | 11.2 | |||
Registered electors | 11,485 | ||||
Turnout | 42.6 | ||||
Conservative hold | Swing | ||||
[21][22][23]
Heswall[edit]
| Party | Candidate | Votes | % | ± | |
|---|---|---|---|---|---|
Conservative | Peter Johnson | 2,766 | 62.7 | ||
Labour | Audrey Moore | 785 | 17.8 | ||
UKIP | David Scott | 413 | 9.4 | ||
Green | Barbara Burton | 261 | 5.9 | ||
Liberal Democrat | David Tyrrell | 186 | 4.2 | ||
| Majority | 1,981 | 44.9 | |||
Registered electors | 10,926 | ||||
Turnout | 40.5 | ||||
Conservative hold | Swing | ||||
[24][25]
Hoylake and Meols[edit]
| Party | Candidate | Votes | % | ± | |
|---|---|---|---|---|---|
Conservative | John Hale | 2,134 | 53.6 | ||
Labour | Alan Milne | 1,056 | 26.5 | ||
Liberal Democrat | Joseph McDowell | 187 | 4.7 | ||
Green | Yvonne McGinley | 334 | 8.4 | ||
UKIP | George Robinson | 274 | 6.9 | ||
| Majority | 1,078 | 27.1 | |||
Registered electors | 10,327 | ||||
Turnout | 38.8 | ||||
Conservative hold | Swing | ||||
[26][27]
Leasowe and Moreton East[edit]
| Party | Candidate | Votes | % | ± | |
|---|---|---|---|---|---|
Labour | Anita Leech | 2,094 | 51.0 | ||
Conservative | Ian Lewis | 1,776 | 43.3 | ||
UKIP | Catherine Williams | 144 | 3.5 | ||
Green | Cynthia Stonall | 89 | 2.2 | ||
| Majority | 318 | 7.7 | |||
Registered electors | 10,466 | ||||
Turnout | 39.3 | ||||
Labour gain from Conservative | Swing | ||||
[28][29][30]
Liscard[edit]
| Party | Candidate | Votes | % | ± | |
|---|---|---|---|---|---|
Labour | Janette Williamson | 1,882 | 49.9 | ||
Conservative | James Keeley | 1,261 | 33.4 | ||
UKIP | Lynda Williams | 400 | 10.6 | ||
Green | Kenneth Peers | 230 | 6.1 | ||
| Majority | 621 | 16.5 | |||
Registered electors | 10,991 | ||||
Turnout | 34.5 | ||||
Labour gain from Conservative | Swing | ||||
[31][32][33]
Moreton West and Saughall Massie[edit]
| Party | Candidate | Votes | % | ± | |
|---|---|---|---|---|---|
Conservative | Chris Blakeley | 2,269 | 57.4 | ||
Labour | Karl Greaney | 1,369 | 34.6 | ||
UKIP | Susan Whitham | 223 | 5.6 | ||
Green | Perle Sheldricks | 95 | 2.4 | ||
| Majority | 900 | 22.8 | |||
Registered electors | 10,655 | ||||
Turnout | 37.2 | ||||
Conservative hold | Swing | ||||
[34][35]
New Brighton[edit]
| Party | Candidate | Votes | % | ± | |
|---|---|---|---|---|---|
Labour | Robert Gregson | 1,908 | 52.8 | ||
Conservative | Sue Taylor | 1,032 | 28.5 | ||
UKIP | Bill Duffey | 366 | 10.1 | ||
Green | James Brady | 309 | 8.5 | ||
| Majority | 876 | 24.3 | |||
Registered electors | 10,669 | ||||
Turnout | 34.0 | ||||
Labour gain from Conservative | Swing | ||||
[36][37][38]
Oxton[edit]
| Party | Candidate | Votes | % | ± | |
|---|---|---|---|---|---|
Liberal Democrat | Pat Williams | 2,026 | 45.8 | ||
Labour | Matthew Patrick | 1,763 | 39.8 | ||
UKIP | Philip Grittiths | 258 | 5.8 | ||
Conservative | Tina McDonnell | 232 | 5.2 | ||
Green | Elisabeth Heydon | 149 | 3.4 | ||
| Majority | 263 | 6.0 | |||
Registered electors | 11,140 | ||||
Turnout | 39.9 | ||||
Liberal Democrat hold | Swing | ||||
[39][40][41]
Pensby and Thingwall[edit]
| Party | Candidate | Votes | % | ± | |
|---|---|---|---|---|---|
Labour | Michael Sullivan | 1,406 | 32.8 | ||
Conservative | Tom Anderson [n 1] | 1,217 | 28.4 | ||
Liberal Democrat | Damien Cummins | 1,079 | 25.2 | ||
UKIP | Janet Davison | 394 | 9.2 | ||
Green | Allen Burton | 190 | 4.4 | ||
| Majority | 189 | 4.4 | N/A | ||
Registered electors | 10,462 | ||||
Turnout | 41.1 | ||||
Labour gain from Liberal Democrat | Swing | ||||
[42][43][44]
Prenton[edit]
| Party | Candidate | Votes | % | ± | |
|---|---|---|---|---|---|
Labour | Tony Norbury | 2,061 | 53.9 | ||
Liberal Democrat | Frank Doyle | 895 | 23.4 | ||
Conservative | Cyrus Ferguson | 357 | 9.3 | ||
UKIP | James Bradshaw | 313 | 8.2 | ||
Green | Mark Mitchell | 200 | 5.2 | ||
| Majority | 1,166 | 30.5 | |||
Registered electors | 10,595 | ||||
Turnout | 36.2 | ||||
Labour gain from Liberal Democrat | Swing | ||||
[45][46]
Rock Ferry[edit]
| Party | Candidate | Votes | % | ± | |
|---|---|---|---|---|---|
Labour | Bill Davies | 1,941 | 70.7 | ||
Conservative | Barbara Poole | 202 | 7.4 | ||
UKIP | Ann Flynn | 195 | 7.1 | ||
TUSC | Morag Reid | 130 | 4.7 | New | |
Green | Joy Hogg | 115 | 4.2 | ||
Liberal Democrat | Brian Hall | 85 | 3.1 | ||
Independent | Jim Pritchard | 76 | 2.8 | New | |
| Majority | 1,739 | 63.3 | |||
Registered electors | 9,564 | ||||
Turnout | 28.7 | ||||
Labour hold | Swing | ||||
[47][48]
Seacombe[edit]
| Party | Candidate | Votes | % | ± | |
|---|---|---|---|---|---|
Labour | John Salter | 1,996 | 74.8 | ||
UKIP | Christopher Wellstead | 278 | 10.4 | ||
Conservative | Ann Lavin | 258 | 9.7 | ||
Green | Timothy Denton | 135 | 5.1 | ||
| Majority | 1,718 | 64.4 | |||
Registered electors | 10,338 | ||||
Turnout | 25.9 | ||||
Labour hold | Swing | ||||
[49][50]
Upton[edit]
| Party | Candidate | Votes | % | ± | |
|---|---|---|---|---|---|
Labour | Sylvia Hodrien | 2,504 | 59.6 | ||
Conservative | Denis Knowles | 948 | 22.6 | ||
UKIP | Patricia Lamb | 381 | 9.1 | ||
Green | Lesley Hussenbux | 205 | 4.9 | ||
Liberal Democrat | Alan Davies | 164 | 3.9 | ||
| Majority | 1,556 | 37.0 | |||
Registered electors | 12,171 | ||||
Turnout | 34.6 | ||||
Labour gain from Conservative | Swing | ||||
[51][52][53]
Wallasey[edit]
| Party | Candidate | Votes | % | ± | |
|---|---|---|---|---|---|
Conservative | Leah Fraser | 2,652 | 56.1 | ||
Labour | Alan Hannaford | 1,590 | 33.6 | ||
UKIP | Ian Watson | 276 | 5.8 | ||
Green | Janet Wright | 208 | 4.4 | ||
| Majority | 1,062 | 22.5 | |||
Registered electors | 11,863 | ||||
Turnout | 40.0 | ||||
Conservative hold | Swing | ||||
[54][55]
West Kirby and Thurstaston[edit]
| Party | Candidate | Votes | % | ± | |
|---|---|---|---|---|---|
Conservative | Geoffrey Watt | 2,180 | 51.9 | ||
Labour | Louise Reecejones | 1,082 | 25.8 | ||
Green | Shirley Johnson | 270 | 6.4 | ||
Liberal Democrat | John Cresswell | 231 | 5.5 | ||
UKIP | Frank Whitham | 230 | 5.5 | ||
Independent | Charles Barnes | 206 | 4.9 | ||
| Majority | 1,098 | 26.1 | |||
Registered electors | 10,276 | ||||
Turnout | 40.9 | ||||
Conservative hold | Swing | ||||
[56][57][58]
Changes between 2012 and 2014[edit]
Leasowe and Moreton East by-election 2013[edit]
| Party | Candidate | Votes | % | ± | |
|---|---|---|---|---|---|
Conservative | Ian Lewis | 1,620 | 50.5 | ||
Labour | Pauline Daniels | 1,355 | 42.2 | ||
UKIP | Susan Whitham | 148 | 4.6 | ||
TUSC | Mark Halligan | 31 | 1.0 | New | |
Liberal Democrat | Daniel Clein | 28 | 0.9 | New | |
Green | Jim McGinley | 28 | 0.9 | ||
| Majority | 265 | 8.3 | N/A | ||
Registered electors | 10,551 | ||||
Turnout | 30.5 | ||||
Conservative gain from Labour | Swing | ||||
[59][30]
Heswall by-election 2013[edit]
| Party | Candidate | Votes | % | ± | |
|---|---|---|---|---|---|
Conservative | Kathryn Hodson | 1,254 | 58.8 | ||
UKIP | David Scott | 460 | 21.6 | ||
Labour | Mike Holliday | 289 | 13.6 | -4.2 | |
Green | Barbara Burton | 110 | 5.2 | ||
TUSC | Greg North | 19 | 0.9 | New | |
| Majority | 794 | 37.2 | |||
Registered electors | 10,855 | ||||
Turnout | 19.7 | ||||
Conservative hold | Swing | ||||
[60][13]
Pensby and Thingwall by-election 2013[edit]
| Party | Candidate | Votes | % | ± | |
|---|---|---|---|---|---|
Labour | Phillip Brightmore | 1,411 | 38.5 | ||
Conservative | Sheila Clarke | 868 | 23.7 | ||
Liberal Democrat | Damien Cummins | 834 | 22.7 | ||
UKIP | Jan Davison | 426 | 11.6 | ||
Green | Allen Burton | 74 | 2.0 | ||
English Democrat | Neil Kenny | 53 | 1.4 | New | |
| Majority | 543 | 14.8 | |||
Registered electors | 10,487 | ||||
Turnout | 35.0 | ||||
Labour gain from Conservative | Swing | ||||
[61][16][5]
Upton by-election 2013[edit]
| Party | Candidate | Votes | % | ± | |
|---|---|---|---|---|---|
Labour | Matthew Patrick | 1,954 | 65.4 | ||
Conservative | Geoffrey Gubb | 762 | 25.5 | ||
Green | Jim McGinley | 143 | 4.8 | ||
Liberal Democrat | Alan Davies | 130 | 4.3 | ||
| Majority | 1,192 | 39.9 | |||
Registered electors | 12,154 | ||||
Turnout | 3,031 | 24.9 | |||
| Rejected ballots | 21 | 0.7 | |||
Labour hold | Swing | ||||
[62][41]
Other changes[edit]
| Date | Ward | Name | Previous affiliation | New affiliation | Circumstance | ||
|---|---|---|---|---|---|---|---|
| 30 April 2013 | Pensby and Thingwall | Mark Johnston | Liberal Democrat | Independent | Resigned.[63] | ||
Notes[edit]
^ Incumbent councillor for Upton ward.
• italics denote the sitting councillor • bold denotes the winning candidate
References[edit]
^ abc "Election Result for 3 May 2012 Summary". Wirral Metropolitan Borough Council..mw-parser-output cite.citationfont-style:inherit.mw-parser-output .citation qquotes:"""""""'""'".mw-parser-output .citation .cs1-lock-free abackground:url("//upload.wikimedia.org/wikipedia/commons/thumb/6/65/Lock-green.svg/9px-Lock-green.svg.png")no-repeat;background-position:right .1em center.mw-parser-output .citation .cs1-lock-limited a,.mw-parser-output .citation .cs1-lock-registration abackground:url("//upload.wikimedia.org/wikipedia/commons/thumb/d/d6/Lock-gray-alt-2.svg/9px-Lock-gray-alt-2.svg.png")no-repeat;background-position:right .1em center.mw-parser-output .citation .cs1-lock-subscription abackground:url("//upload.wikimedia.org/wikipedia/commons/thumb/a/aa/Lock-red-alt-2.svg/9px-Lock-red-alt-2.svg.png")no-repeat;background-position:right .1em center.mw-parser-output .cs1-subscription,.mw-parser-output .cs1-registrationcolor:#555.mw-parser-output .cs1-subscription span,.mw-parser-output .cs1-registration spanborder-bottom:1px dotted;cursor:help.mw-parser-output .cs1-ws-icon abackground:url("//upload.wikimedia.org/wikipedia/commons/thumb/4/4c/Wikisource-logo.svg/12px-Wikisource-logo.svg.png")no-repeat;background-position:right .1em center.mw-parser-output code.cs1-codecolor:inherit;background:inherit;border:inherit;padding:inherit.mw-parser-output .cs1-hidden-errordisplay:none;font-size:100%.mw-parser-output .cs1-visible-errorfont-size:100%.mw-parser-output .cs1-maintdisplay:none;color:#33aa33;margin-left:0.3em.mw-parser-output .cs1-subscription,.mw-parser-output .cs1-registration,.mw-parser-output .cs1-formatfont-size:95%.mw-parser-output .cs1-kern-left,.mw-parser-output .cs1-kern-wl-leftpadding-left:0.2em.mw-parser-output .cs1-kern-right,.mw-parser-output .cs1-kern-wl-rightpadding-right:0.2em
^ "Wirral Council under Labour control as party win majority". Liverpool Echo.
^ "Election Result for Bebington ward on 3 May 2012". Wirral Metropolitan Borough Council.
^ "Councillor Christina Muspratt". Wirral Metropolitan Borough Council.
^ ab "Councillor Sheila Clarke MBE". Wirral Metropolitan Borough Council.
^ "Election Result for Bidston and St James ward on 3 May 2012". Wirral Metropolitan Borough Council.
^ "Councillor Jim Crabtree". Wirral Metropolitan Borough Council.
^ "Election Result for Birkenhead and Tranmere ward on 3 May 2012". Wirral Metropolitan Borough Council.
^ "Councillor Pat Cleary". Wirral Metropolitan Borough Council.
^ "Councillor Allan Brame". Wirral Metropolitan Borough Council.
^ "Election Result for Bromborough ward on 3 May 2012". Wirral Metropolitan Borough Council.
^ "Councillor Steve Niblock". Wirral Metropolitan Borough Council.
^ ab "Councillor Kathy Hodson". Wirral Metropolitan Borough Council.
^ "Election Result for Clatterbridge ward on 3 May 2012". Wirral Metropolitan Borough Council.
^ "Councillor Cherry Povall, JP". Wirral Metropolitan Borough Council.
^ ab "Councillor Phillip Brightmore". Wirral Metropolitan Borough Council.
^ "Election Result for Claughton ward on 3 May 2012". Wirral Metropolitan Borough Council.
^ "Councillor George Davies". Wirral Metropolitan Borough Council.
^ "Election Result for Eastham ward on 3 May 2012". Wirral Metropolitan Borough Council.
^ "Councillor Phil Gilchrist". Wirral Metropolitan Borough Council.
^ "Election Result for Greasby, Frankby and Irby ward on 3 May 2012". Wirral Metropolitan Borough Council.
^ "Councillor Tony Cox". Wirral Metropolitan Borough Council.
^ "Councillor Peter Reisdorf". Wirral Metropolitan Borough Council.
^ "Election Result for Heswall ward on 3 May 2012". Wirral Metropolitan Borough Council.
^ "Councillor Peter Johnson". Wirral Metropolitan Borough Council.
^ "Election Result for Hoylake and Meols ward on 3 May 2012". Wirral Metropolitan Borough Council.
^ "Councillor John Hale". Wirral Metropolitan Borough Council.
^ "Election Result for Leasowe and Moreton East ward on 3 May 2012". Wirral Metropolitan Borough Council.
^ "Councillor Anita Leech". Wirral Metropolitan Borough Council.
^ ab "Councillor Ian Lewis". Wirral Metropolitan Borough Council.
^ "Election Result for Liscard ward on 3 May 2012". Wirral Metropolitan Borough Council.
^ "Councillor Janette Williamson". Wirral Metropolitan Borough Council.
^ "Councillor James Keeley". Wirral Metropolitan Borough Council.
^ "Election Result for Moreton West and Saughall Massie ward on 3 May 2012". Wirral Metropolitan Borough Council.
^ "Councillor Chris Blakeley". Wirral Metropolitan Borough Council.
^ "Election Result for New Brighton ward on 3 May 2012". Wirral Metropolitan Borough Council.
^ "Councillor Robert Gregson". Wirral Metropolitan Borough Council.
^ "Councillor Sue Taylor". Wirral Metropolitan Borough Council.
^ "Election Result for Oxton ward on 3 May 2012". Wirral Metropolitan Borough Council.
^ "Councillor Pat Williams". Wirral Metropolitan Borough Council.
^ ab "Councillor Matthew Patrick". Wirral Metropolitan Borough Council.
^ "Election Result for Pensby and Thingwall ward on 3 May 2012". Wirral Metropolitan Borough Council.
^ "Councillor Michael Sullivan". Wirral Metropolitan Borough Council.
^ "Councillor Tom Anderson". Wirral Metropolitan Borough Council.
^ "Election Result for Prenton ward on 3 May 2012". Wirral Metropolitan Borough Council.
^ "Councillor Tony Norbury". Wirral Metropolitan Borough Council.
^ "Election Result for Rock Ferry ward on 3 May 2012". Wirral Metropolitan Borough Council.
^ "Councillor Bill Davies". Wirral Metropolitan Borough Council.
^ "Election Result for Seacombe ward on3 May 2012". Wirral Metropolitan Borough Council.
^ "Councillor John Salter". Wirral Metropolitan Borough Council.
^ "Election Result for Upton ward on 3 May 2012". Wirral Metropolitan Borough Council.
^ "Councillor Sylvia Hodrien". Wirral Metropolitan Borough Council.
^ "Councillor Denis Knowles". Wirral Metropolitan Borough Council.
^ "Election Result for Wallasey ward on 3 May 2012". Wirral Metropolitan Borough Council.
^ "Councillor Leah Fraser". Wirral Metropolitan Borough Council.
^ "Election Result for West Kirby and Thurstaston ward on 3 May 2012". Wirral Metropolitan Borough Council.
^ "Councillor Geoffrey Watt". Wirral Metropolitan Borough Council.
^ "Councillor Louise Reecejones". Wirral Metropolitan Borough Council.
^ "Election Result for Leasowe and Moreton East ward on 17 January 2013". Wirral Metropolitan Borough Council. January 2013. Retrieved 1 March 2013.
^ "Election Result for Heswall ward on 17 January 2013". Wirral Metropolitan Borough Council. January 2013. Retrieved 1 March 2013.
^ "Election Result for Pensby and Thingwall ward on 28 February 2013". Wirral Metropolitan Borough Council. 1 March 2013. Retrieved 1 March 2013.
^ "Election Result for Upton ward on 24 October 2013". Wirral Metropolitan Borough Council.
^ Murphy, Liam (30 April 2013). "Wirral councillor Mark Johnson quits Liberal Democrat Party". Liverpool Echo. Retrieved 28 December 2018.
| Knowsley Metropolitan Borough Council |
|
|---|---|
| Liverpool City Council |
|
| Mayor of Liverpool |
|
| Sefton Metropolitan Borough Council |
|
| St Helens Metropolitan Borough Council |
|
| Wirral Metropolitan Borough Council |
|
| Liverpool School Board |
|
| Merseyside County Council |
|
| Liverpool City Region Mayor |
|
| |
(2011 ←) | |
|---|---|
Metropolitan boroughs (England) |
|
Unitary authorities (England) |
|
District councils (England) |
|
Unitary authorities (Wales) |
|
Unitary authorities (Scotland) |
|
| Mayoral elections |
|
| PCC elections |
|
| Regional assembly elections |
|
Categories:
- 2012 English local elections
- Council elections in Wirral
- 21st century in Merseyside
(window.RLQ=window.RLQ||).push(function()mw.config.set("wgPageParseReport":"limitreport":"cputime":"1.304","walltime":"1.485","ppvisitednodes":"value":16062,"limit":1000000,"ppgeneratednodes":"value":0,"limit":1500000,"postexpandincludesize":"value":394182,"limit":2097152,"templateargumentsize":"value":52200,"limit":2097152,"expansiondepth":"value":18,"limit":40,"expensivefunctioncount":"value":10,"limit":500,"unstrip-depth":"value":1,"limit":20,"unstrip-size":"value":177589,"limit":5000000,"entityaccesscount":"value":0,"limit":400,"timingprofile":["100.00% 927.441 1 -total"," 38.39% 356.009 2 Template:Reflist"," 31.72% 294.190 62 Template:Cite_web"," 21.31% 197.633 1 Template:Infobox_election"," 16.34% 151.505 1 Template:Infobox"," 9.19% 85.230 3 Template:Infobox_election/row"," 8.96% 83.137 104 Template:Election_box_candidate_with_party_link"," 5.12% 47.442 8 Template:Election_Summary_Party_with_Candidates"," 4.10% 37.991 2 Template:Navbox"," 3.73% 34.581 1 Template:Main"],"scribunto":"limitreport-timeusage":"value":"0.320","limit":"10.000","limitreport-memusage":"value":5253839,"limit":52428800,"cachereport":"origin":"mw1307","timestamp":"20190317032738","ttl":2592000,"transientcontent":false);mw.config.set("wgBackendResponseTime":131,"wgHostname":"mw1326"););


