California's 40th congressional district
| California's 40th congressional district | |||
|---|---|---|---|
 California's 40th congressional district - since January 3, 2013. | |||
| U.S. Representative |
| ||
| Median income | $47,190[1] | ||
| Ethnicity |
| ||
| Cook PVI | D+33[3] | ||
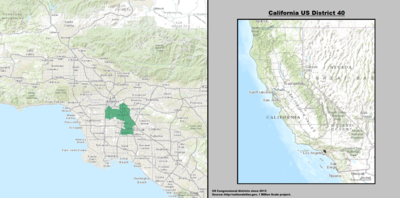
California's 40th congressional district is a congressional district in the U.S. state of California.
The district is currently represented by Democrat Lucille Roybal-Allard. The district includes Downey, East Los Angeles, Commerce, Paramount, Bell, Bell Gardens, Bellflower, Cudahy, Huntington Park, Maywood, and the neighborhoods of Florence, Florence-Graham, Historic South Central and South Park, in South Los Angeles. It is the most Latino district in the nation, at 86.5%.
.mw-parser-output .toclimit-2 .toclevel-1 ul,.mw-parser-output .toclimit-3 .toclevel-2 ul,.mw-parser-output .toclimit-4 .toclevel-3 ul,.mw-parser-output .toclimit-5 .toclevel-4 ul,.mw-parser-output .toclimit-6 .toclevel-5 ul,.mw-parser-output .toclimit-7 .toclevel-6 uldisplay:none
Contents
1 Competitiveness
1.1 In statewide races
2 List of members representing the district
3 Election results
3.1 1972
3.2 1974
3.3 1976
3.4 1978
3.5 1980
3.6 1982
3.7 1984
3.8 1986
3.9 1988
3.10 1990
3.11 1992
3.12 1994
3.13 1996
3.14 1998
3.15 2000
3.16 2002
3.17 2004
3.18 2006
3.19 2008
3.20 2010
3.21 2012
3.22 2014
3.23 2016
3.24 2018
4 Living former representatives
5 Historical district boundaries
6 See also
7 References
8 External links
Competitiveness
In statewide races
| Election results from statewide races | ||
|---|---|---|
| Year | Office | Results |
| 1990 | Governor[4] | Wilson 63.6% - 32.0% |
| 1992 | President[5] | Bush 39.9% - 35.2% |
Senator[6] | Herschensohn 55.7% - 32.8% | |
Senator (Special)[7] | Seymour 49.5% - 39.6% | |
| 1994 | Governor[8] | Wilson 66.6% - 27.5% |
Senator[9] | Huffington 60.4% – 29.0% | |
| 1996 | President[10] | Dole 48.8% – 37.7% |
| 1998 | Governor[11] | Lungren 49.2% – 46.6% |
Senator[12] | Fong 53.8% – 40.9% | |
| 2000 | President[13] | Bush 56.0% - 39.3% |
Senator[14] | Campbell 50.4% - 41.9% | |
| 2002 | Governor[15] | Simon 57.7% - 34.6% |
| 2003 | Recall[16][17] | |
Schwarzenegger 62.4% - 16.5% | ||
| 2004 | President[18] | Bush 60.2% - 38.4% |
Senator[19] | Jones 50.9% - 43.8% | |
| 2006 | Governor[20] | Schwarzenegger 69.0% - 26.0% |
Senator[21] | Mountjoy 50.2% - 44.5% | |
| 2008 | President[22] | McCain 51.1% - 46.6% |
| 2010 | Governor[23] | Whitman 55.8% - 38.0% |
Senator[24] | Fiorina 57.0% - 37.2% | |
| 2012 | President[25] | Obama 81.5% - 16.5% |
U.S. Senator[26] | Feinstein 81.2% - 18.8% | |
| 2014 | Governor[27] | Brown 76.2% – 23.8% |
| 2016 | President[28] | Clinton 82.2% - 12.8% |
U.S. Senator[29] | Sanchez 56.4% - 43.6% | |
| 2018 | Governor | TBC |
Senator | TBC | |
List of members representing the district
District created January 3, 1973.
| Representative | Party | Dates | Electoral history | Counties |
|---|---|---|---|---|
 Bob Wilson | Republican | January 3, 1973 – January 3, 1975 | Redistricted from the 37th district. Redistricted to the 41st district. | San Diego (San Diego City northern half) |
 Andrew J. Hinshaw | Republican | January 3, 1975 – January 3, 1977 | Redistricted from the 39th district. Lost renomination. | Southern Orange, northwestern San Diego |
 Robert Badham | Republican | January 3, 1977 – January 3, 1983 | Retired. | |
| January 3, 1983 – January 3, 1989 | Central Orange | |||
 Christopher Cox | Republican | January 3, 1989 – January 3, 1993 | Redistricted to the 47th district. | |
 Jerry Lewis | Republican | January 3, 1993 – January 3, 2003 | Redistricted from the 35th district. Redistricted to the 41st district. | Inyo, San Bernardino |
 Ed Royce | Republican | January 3, 2003 – January 3, 2013 | Redistricted from the 39th district. Redistricted to the 39th district. | Northern Orange |
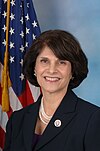 Lucille Roybal-Allard | Democratic | January 3, 2013 – present | Redistricted from the 34th district. | Los Angeles (Downey and East Los Angeles) |
Election results
1972 • 1974 • 1976 • 1978 • 1980 • 1982 • 1984 • 1986 • 1988 • 1990 • 1992 • 1994 • 1996 • 1998 • 2000 • 2002 • 2004 • 2006 • 2008 • 2010 • 2012 • 2014 |
1972
| Party | Candidate | Votes | % | |
|---|---|---|---|---|
Republican | Bob Wilson (incumbent) | 153,648 | 67.8 | |
Democratic | Frank Caprio | 68,771 | 30.3 | |
American Independent | Fritjof Thygeson | 4,294 | 1.9 | |
| Total votes | 226,713 | 100.0 | ||
Turnout | ||||
Republican hold | ||||
1974
| Party | Candidate | Votes | % | |
|---|---|---|---|---|
Republican | Andrew J. Hinshaw (Incumbent) | 114,895 | 63.4 | |
Democratic | Roderick J. "Rod" Wilson | 56,195 | 30.9 | |
American Independent | Grayson L. Watkins | 10,381 | 5.7 | |
| Total votes | 181,471 | 100.0 | ||
Turnout | ||||
Republican hold | ||||
1976
| Party | Candidate | Votes | % | |
|---|---|---|---|---|
Republican | Robert Badham | 148,512 | 59.3 | |
Democratic | Vivian Hall | 102,132 | 40.7 | |
| Total votes | 250,644 | 100.0 | ||
Turnout | ||||
Republican hold | ||||
1978
| Party | Candidate | Votes | % | |
|---|---|---|---|---|
Republican | Robert Badham (incumbent) | 147,882 | 65.9 | |
Democratic | Jim McGuy | 76,358 | 34.1 | |
| Total votes | 224,240 | 100.0 | ||
Turnout | ||||
Republican hold | ||||
1980
| Party | Candidate | Votes | % | |
|---|---|---|---|---|
Republican | Robert Badham (incumbent) | 213,999 | 70.2 | |
Democratic | Michael F. Dow | 66,512 | 21.8 | |
Libertarian | Dan Mahaffey | 24,486 | 8.0 | |
| Total votes | 304,997 | 100.0 | ||
Turnout | ||||
Republican hold | ||||
1982
| Party | Candidate | Votes | % | |
|---|---|---|---|---|
Republican | Robert Badham (incumbent) | 144,228 | 71.5 | |
Democratic | Paul Hasenman | 52,546 | 26.1 | |
Peace and Freedom | Maxine Bell Quirk | 4,826 | 2.4 | |
| Total votes | 201,600 | 100.0 | ||
Turnout | ||||
Republican hold | ||||
1984
| Party | Candidate | Votes | % | |
|---|---|---|---|---|
Republican | Robert Badham (incumbent) | 164,257 | 64.4 | |
Democratic | Carol Ann Bradford | 86,748 | 34.0 | |
Peace and Freedom | Maxine Bell Quirk | 3,969 | 1.6 | |
| Total votes | 254,974 | 100.0 | ||
Turnout | ||||
Republican hold | ||||
1986
| Party | Candidate | Votes | % | |
|---|---|---|---|---|
Republican | Robert Badham (incumbent) | 119,829 | 59.8 | |
Democratic | Bruce W. Sumner | 75,664 | 37.7 | |
Peace and Freedom | Steve Sears | 5,025 | 2.5 | |
| Total votes | 200,518 | 100.0 | ||
Turnout | ||||
Republican hold | ||||
1988
| Party | Candidate | Votes | % | |
|---|---|---|---|---|
Republican | Chris Cox | 181,269 | 67.1 | |
Democratic | Lida Lenney | 80,782 | 29.9 | |
Libertarian | Roger Bloxham | 4,539 | 1.7 | |
Peace and Freedom | Gretchen J. Farsai | 3,699 | 1.4 | |
Independent | Write-ins | 87 | 0.0 | |
| Total votes | 270,376 | 100.0 | ||
Turnout | ||||
Republican hold | ||||
1990
| Party | Candidate | Votes | % | |
|---|---|---|---|---|
Republican | Chris Cox (incumbent) | 142,299 | 67.6 | |
Democratic | Eugene Gratz | 68,087 | 32.4 | |
| Total votes | 210,376 | 100.0 | ||
Turnout | ||||
Republican hold | ||||
1992
| Party | Candidate | Votes | % | |
|---|---|---|---|---|
Republican | Jerry Lewis (incumbent) | 129,563 | 63.1 | |
Democratic | Donald M. "Don" Rusk | 63,881 | 31.1 | |
Peace and Freedom | Margie Akin | 11,839 | 5.8 | |
| Total votes | 205,283 | 100.0 | ||
Turnout | ||||
Republican hold | ||||
1994
| Party | Candidate | Votes | % | |
|---|---|---|---|---|
Republican | Jerry Lewis (incumbent) | 115,728 | 70.7 | |
Democratic | Donald M. "Don" Rusk | 48,003 | 29.3 | |
| Total votes | 163,731 | 100.0 | ||
Turnout | ||||
Republican hold | ||||
1996
| Party | Candidate | Votes | % | |
|---|---|---|---|---|
Republican | Jerry Lewis (incumbent) | 98,821 | 65.0 | |
Democratic | Robert Conaway | 44,102 | 29.0 | |
American Independent | Hale McGee | 4,963 | 3.2 | |
Libertarian | Joseph Kelly | 4,375 | 2.8 | |
| Total votes | 132,261 | 100.0 | ||
Turnout | ||||
Republican hold | ||||
1998
| Party | Candidate | Votes | % | |
|---|---|---|---|---|
Republican | Jerry Lewis (incumbent) | 97,406 | 64.9 | |
Democratic | Robert "Bob" Conaway | 47,897 | 31.9 | |
Libertarian | Maurice Mayben | 4,822 | 3.2 | |
| Total votes | 150,125 | 100.0 | ||
Turnout | ||||
Republican hold | ||||
2000
| Party | Candidate | Votes | % | |
|---|---|---|---|---|
Republican | Jerry Lewis (incumbent) | 151,069 | 80.0 | |
Natural Law | Frank N. Schmidt | 19,029 | 10.0 | |
Libertarian | Jay Lindberg | 18,924 | 10.0 | |
| Total votes | 189,022 | 100.0 | ||
Turnout | ||||
Republican hold | ||||
2002
| Party | Candidate | Votes | % | |
|---|---|---|---|---|
Republican | Ed Royce (incumbent) | 92,422 | 67.7 | |
Democratic | Christina Avalos | 40,265 | 29.5 | |
Libertarian | Charles R. "Chuck" McGlawn | 3,955 | 2.8 | |
| Total votes | 136,642 | 100.0 | ||
Turnout | ||||
Republican hold | ||||
2004
| Party | Candidate | Votes | % | |
|---|---|---|---|---|
Republican | Ed Royce (incumbent) | 189,336 | 68.0 | |
Democratic | Tilman Williams | 69,684 | 32.0 | |
| Total votes | 259,020 | 100.0 | ||
Turnout | ||||
Republican hold | ||||
2006
| Party | Candidate | Votes | % | |
|---|---|---|---|---|
Republican | Ed Royce (incumbent) | 100,995 | 66.8 | |
Democratic | Florice Orea Hoffman | 46,418 | 30.7 | |
Libertarian | Philip H. Inman | 3,876 | 2.5 | |
| Total votes | 151,289 | 100.0 | ||
Turnout | ||||
Republican hold | ||||
2008
| Party | Candidate | Votes | % | |
|---|---|---|---|---|
Republican | Ed Royce (incumbent) | 144,923 | 62.6 | |
Democratic | Christina Avalos | 86,772 | 37.4 | |
| Total votes | 231,695 | 100.0 | ||
Turnout | ||||
Republican hold | ||||
2010
| Party | Candidate | Votes | % | |
|---|---|---|---|---|
Republican | Ed Royce (incumbent) | 119,455 | 66.8 | |
Democratic | Christina Avalos | 59,400 | 33.2 | |
| Total votes | 178,855 | 100.0 | ||
Turnout | ||||
Republican hold | ||||
2012
| Party | Candidate | Votes | % | |
|---|---|---|---|---|
Democratic | Lucille Roybal-Allard (incumbent) | 73,940 | 58.9 | |
Democratic | David Sanchez | 51,613 | 41.1 | |
| Total votes | 125,553 | 100.0 | ||
Democratic hold | ||||
2014
| Party | Candidate | Votes | % | |
|---|---|---|---|---|
Democratic | Lucille Roybal-Allard (incumbent) | 30,208 | 61.2 | |
Democratic | David Sanchez | 19,171 | 38.8 | |
| Total votes | 49,379 | 100.0 | ||
Democratic hold | ||||
2016
| Party | Candidate | Votes | % | |
|---|---|---|---|---|
Democratic | Lucille Roybal-Allard (incumbent) | 106,554 | 81.2 | |
Independent | Roman Gonzalez | 24,743 | 18.8 | |
| Total votes | 131,297 | 100% | ||
Democratic hold | ||||
2018
| Party | Candidate | Votes | % | |
|---|---|---|---|---|
Democratic | Lucille Roybal-Allard (incumbent) | 93,938 | 77.3 | |
Green | Rodolfo Cortes Barragan | 27,511 | 22.7 | |
| Total votes | 121,449 | 100.0 | ||
Democratic hold | ||||
Living former representatives
As of January 2019[update], there are three former members of the U.S. House of Representatives from California's 40th congressional district that are currently living.The most recent representative to die was Andrew J. Hinshaw (served 1975–1977) on February 7, 2015. the most recently serving representative to die was Robert Badham (served 1977-89) on October 21, 2005.
| Representative | Term in office | Date of birth (and age) |
|---|---|---|
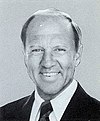
Christopher Cox | 1979 - 1993 | (1952-10-16) October 16, 1952 |
Jerry Lewis | 1993 - 2003 | (1934-10-21) October 21, 1934 |
Ed Royce | 2003 - 2013 | (1951-10-12) October 12, 1951 |
Historical district boundaries

2003 - 2013
The seat was originally one of five reapportioned to California after the 1970 U.S. Census, but its boundaries have shifted radically through successive redistricting efforts. At various times it has included parts of Orange and San Diego counties, and from 1993 to 2003 it covered eastern San Bernardino and Inyo counties. From 2003 to 2013 the district was based in Orange County. The district covered the cities in the northern part of the county, including Fullerton, Orange, Cypress, Stanton, and Buena Park.
See also
- List of United States congressional districts
References
^ US Census
^ LA Times
^ "Partisan Voting Index – Districts of the 115th Congress" (PDF). The Cook Political Report. April 7, 2017. Retrieved April 7, 2017..mw-parser-output cite.citationfont-style:inherit.mw-parser-output .citation qquotes:"""""""'""'".mw-parser-output .citation .cs1-lock-free abackground:url("//upload.wikimedia.org/wikipedia/commons/thumb/6/65/Lock-green.svg/9px-Lock-green.svg.png")no-repeat;background-position:right .1em center.mw-parser-output .citation .cs1-lock-limited a,.mw-parser-output .citation .cs1-lock-registration abackground:url("//upload.wikimedia.org/wikipedia/commons/thumb/d/d6/Lock-gray-alt-2.svg/9px-Lock-gray-alt-2.svg.png")no-repeat;background-position:right .1em center.mw-parser-output .citation .cs1-lock-subscription abackground:url("//upload.wikimedia.org/wikipedia/commons/thumb/a/aa/Lock-red-alt-2.svg/9px-Lock-red-alt-2.svg.png")no-repeat;background-position:right .1em center.mw-parser-output .cs1-subscription,.mw-parser-output .cs1-registrationcolor:#555.mw-parser-output .cs1-subscription span,.mw-parser-output .cs1-registration spanborder-bottom:1px dotted;cursor:help.mw-parser-output .cs1-ws-icon abackground:url("//upload.wikimedia.org/wikipedia/commons/thumb/4/4c/Wikisource-logo.svg/12px-Wikisource-logo.svg.png")no-repeat;background-position:right .1em center.mw-parser-output code.cs1-codecolor:inherit;background:inherit;border:inherit;padding:inherit.mw-parser-output .cs1-hidden-errordisplay:none;font-size:100%.mw-parser-output .cs1-visible-errorfont-size:100%.mw-parser-output .cs1-maintdisplay:none;color:#33aa33;margin-left:0.3em.mw-parser-output .cs1-subscription,.mw-parser-output .cs1-registration,.mw-parser-output .cs1-formatfont-size:95%.mw-parser-output .cs1-kern-left,.mw-parser-output .cs1-kern-wl-leftpadding-left:0.2em.mw-parser-output .cs1-kern-right,.mw-parser-output .cs1-kern-wl-rightpadding-right:0.2em
^ Statement of Vote (1990 Governor)
^ Statement of Vote (1992 President)
^ Statement of Vote (1992 Senate)
^ Statement of Vote (1992 Senate)
^ Statement of Vote (1994 Governor)
^ Statement of Vote (1994 Senate)
^ Statement of Vote (1996 President)
^ Statement of Vote (1998 Governor) Archived September 29, 2011, at the Wayback Machine
^ Statement of Vote (1998 Senate) Archived September 29, 2011, at the Wayback Machine
^ Statement of Vote (2000 President)
^ Statement of Vote (2000 Senator)
^ Statement of Vote (2002 Governor)
^ Statement of Vote (2003 Recall Question)
^ Statement of Vote (2003 Governor)
^ Statement of Vote (2004 President)
^ Statement of Vote (2004 Senator)
^ Statement of Vote (2006 Governor)
^ Statement of Vote (2006 Senator)
^ Statement of Vote (2008 President)
^ Statement of Vote (2010 Governor)
^ Statement of Vote (2010 Senator)
^ Statement of Vote (2012 President)
^ Statement of Vote (2012 Senator)
^ Statement of Vote (2014 Governor)
^ Statement of Vote (2016 President)
^ Statement of Vote (2016 Senate)
^ 1972 election results
^ 1974 election results
^ 1976 election results
^ 1978 election results
^ 1980 election results
^ 1982 election results
^ 1984 election results
^ 1986 election results
^ 1988 election results
^ 1990 election results
^ 1992 election results
^ 1994 election results
^ 1996 election results
^ 1998 election results
^ 2000 election results
^ 2002 election results
^ 2004 election results
^ 2006 election results
^ 2008 election results
^ 2010 election results
^ 2012 election results
^ 2014 election results
^ 2016 election results
^ 2018 election results
External links
- GovTrack.us: California's 40th congressional district
- RAND California Election Returns: District Definitions
- California Voter Foundation map - CD40
Coordinates: 33°53′41″N 117°55′23″W / 33.894642°N 117.922955°W / 33.894642; -117.922955


